
Every stockroom has two kinds of bad day. One is opening the bin for a critical bearing and finding it empty while a production line waits. The other is the year-end count that reveals thousands of parts nobody has touched in years.
The reorder point formula is the simplest tool for avoiding both. It tells you when to order. Safety stock tells you how much buffer to keep for the days when demand or suppliers misbehave. This guide covers both formulas, works through examples, and explains where the textbook versions break down for spare parts.
What is a reorder point?
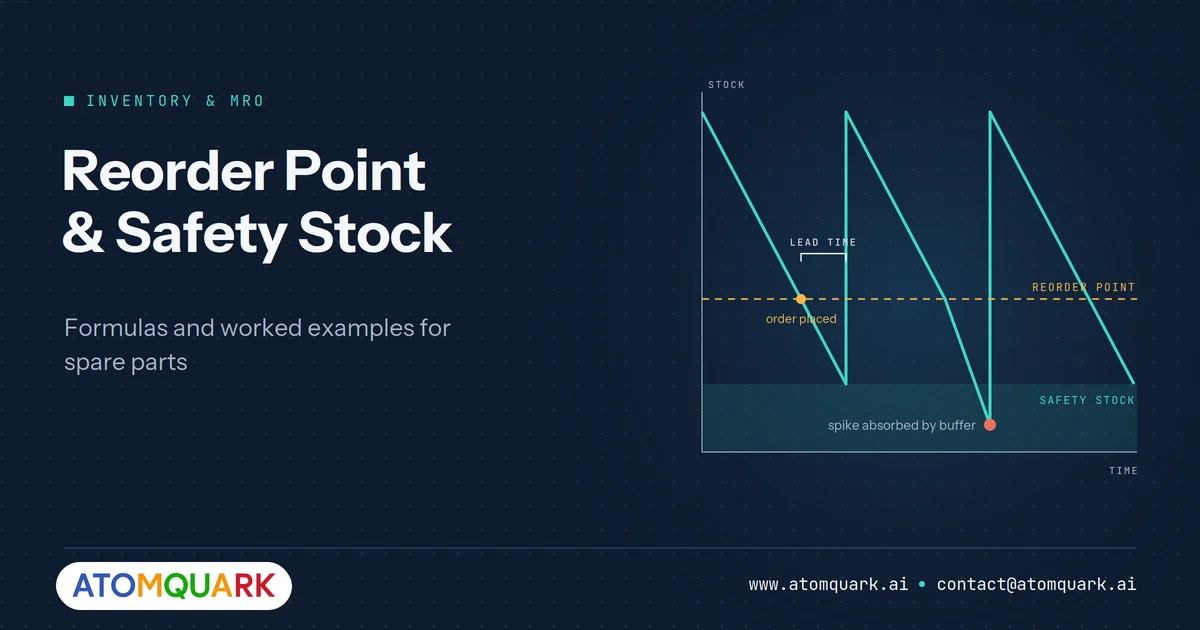
A reorder point (ROP) is the inventory level at which you place a replenishment order so the new stock arrives before you run out. When stock on hand plus stock on order falls to the reorder point, you order.
The reorder point formula
Reorder point = (Average daily demand × Lead time in days) + Safety stock
The first part, lead time demand, covers what you expect to use while waiting for delivery. Safety stock covers what you did not expect.
Worked example
A plant uses an average of 4 V-belts per day. The supplier takes 10 days to deliver. The planner keeps 12 belts as safety stock.
- Lead time demand = 4 × 10 = 40
- Reorder point = 40 + 12 = 52 belts
When stock (including open orders) drops to 52, a new order goes out.
The safety stock formula
There are several safety stock formulas. The two most useful are below.
Basic method
Safety stock = (Maximum daily demand × Maximum lead time) − (Average daily demand × Average lead time)
Example: maximum daily use of the V-belt is 6, maximum lead time is 14 days.
(6 × 14) − (4 × 10) = 84 − 40 = 44 belts
It is easy to calculate but tends to overstate stock, because it assumes the worst demand and the worst lead time happen together.
Service level method (demand variability)
Safety stock = Z × σd × √L
Where:
- Z is the service level factor (about 1.65 for a 95% service level, about 2.33 for 99%)
- σd is the standard deviation of daily demand
- L is lead time in days
Example: daily demand varies with a standard deviation of 1.5 belts, lead time is 10 days, and the target service level is 95%.
1.65 × 1.5 × √10 ≈ 1.65 × 1.5 × 3.16 ≈ 7.8, round up to 8 belts
Reorder point = 40 + 8 = 48 belts.
If lead time is also unpredictable, a combined formula accounts for variability in both demand and lead time. Use it when supplier performance is inconsistent.
Why textbook formulas struggle with spare parts
The formulas above assume steady, roughly normal demand. Spare parts rarely behave that way.
Intermittent demand
Many spares move only a few times a year. Average daily demand of 0.02 produces a reorder point that rounds to zero, even for parts that stop a line when they fail. For these, set a minimum stock based on criticality, or use forecasting methods designed for intermittent demand.
Criticality matters more than volume
A ₹500 gasket that halts a ₹50-lakh-per-day line is more important than a fast-moving consumable. Classify parts by criticality (for example, VED: vital, essential, desirable) alongside ABC value classes, and set service levels by class. Our article on MRO inventory management and unplanned downtime explains criticality-based stocking in detail.
Demand is driven by maintenance, not sales
Planned maintenance tells you in advance that parts will be needed. Feeding the maintenance schedule into demand estimates is more accurate than averaging past issues.
After-sales demand follows the installed base
For service parts supporting products in the field, demand depends on how many units are in use, their age and their failure rates. This is where machine learning forecasting earns its place, as covered in ML-powered spare parts demand forecasting.
Reorder point vs min-max vs EOQ
Reorder points answer when to order. Two related methods answer other questions, and it helps to know how they fit together.
Min-max. Set a minimum (effectively the reorder point) and a maximum. When stock falls to the minimum, order enough to bring it back to the maximum. Simple, widely supported in ERP and inventory systems, and well suited to MRO stores.
Economic order quantity (EOQ). EOQ answers how much to order to balance ordering costs against holding costs:
EOQ = √(2 × Annual demand × Cost per order ÷ Annual holding cost per unit)
For example, with annual demand of 1,200 units, an ordering cost of ₹1,500 per order and a holding cost of ₹100 per unit per year: √(2 × 1,200 × 1,500 ÷ 100) = √36,000 ≈ 190 units per order.
EOQ works for steady, higher-volume consumables. It is rarely useful for slow-moving critical spares, where availability matters far more than ordering efficiency.
In practice, many stores combine them: reorder points with safety stock decide when to order, EOQ or supplier pack sizes decide how much, and min-max rules keep things simple for low-value items.
Worked example: a critical slow-moving spare
A gearbox coupling is used about twice a year. Lead time from the OEM is eight weeks. If it fails without a spare on the shelf, the line it serves stops.
The standard formula gives average daily demand of 2 ÷ 365 ≈ 0.005, and lead time demand of about 0.3 units. Rounded, the reorder point is zero, so the system would never trigger an order until a failure has already happened.
A criticality-based rule works better: classify the coupling as vital, set a minimum stock of 1 (or 2 if the line has two identical drives), and reorder immediately when that unit is issued. The holding cost of one coupling is small compared with eight weeks of lost production.
Review the rule annually. If the equipment is replaced or a second source with a shorter lead time is found, the stocking level can change.
Setting reorder points in practice: a checklist
- Clean the item master. Duplicate part numbers split demand history and make every formula wrong.
- Measure real lead times. Use actual receipt dates, not supplier quotes.
- Classify by criticality and value. Set higher service levels for vital parts.
- Choose a method per class. Formulas for steady movers, minimum stock rules for critical slow movers.
- Count stock on order. Compare the reorder point with on-hand plus on-order stock, or you will double-order.
- Review quarterly. Demand and lead times drift. Static reorder points slowly become wrong.
Where software helps
Spreadsheets work for a few hundred parts. Across thousands of SKUs and several stores, keeping reorder points current by hand becomes impossible, and that is usually when stockouts start.
Atomquark Inventory & MRO monitors consumption patterns and uses AI to predict reorder points before stockouts occur. Spares can be linked to the machines they serve, technicians scan barcodes from Android or iOS devices on the plant floor, and multiple plants and warehouses are managed from one dashboard. Because it runs on your own servers and works without internet, planners can still query stock (for example, which critical spares are below safety stock) when connectivity drops.
For after-sales networks spanning countries and service partners, Atomquark Spares Planning & Forecasting adds ML demand forecasting, service BOM supply planning and automated allocation to service centres.
Frequently Asked Questions
What is the formula for reorder point?
Reorder point = (average daily demand × lead time in days) + safety stock.
How do you calculate safety stock?
A common method is Z × σd × √L, where Z is the service level factor, σd is the standard deviation of daily demand and L is lead time in days. A simpler method subtracts average demand during average lead time from maximum demand during maximum lead time.
What is a good service level for spare parts?
It depends on criticality. Vital parts whose failure stops production often justify 98–99% or higher, while desirable, non-critical parts can run at lower service levels to reduce holding cost.
Should reorder point include stock on order?
Yes. Compare the reorder point with on-hand stock plus open orders, otherwise you may place duplicate orders.
How often should reorder points be updated?
Review at least quarterly, and immediately after significant changes in demand, supplier lead times or maintenance plans.
Stop guessing when to reorder
Accurate reorder points mean fewer stockouts and less dead stock. Book a demo of Atomquark Inventory & MRO to see AI reorder forecasting on your parts data.